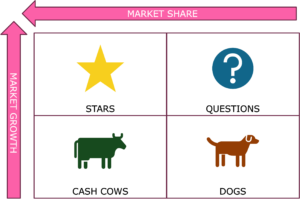
Key Learning Points: The Boston Matrix is a classic strategic tool for assessing an organization’s products. It groups them across two dimensions, representing them in a 2×2 matrix with quadrants labeled: Stars, Cash-cows, Question Marks and Dogs.
Boston Matrix
The Boston Matrix, which gets its name from the Boston Consulting Group and is sometimes known as the BCG matrix, was developed in the 1970s as a way to analyze products and product lines in businesses.
It considers two axis (market growth and market share) and divides products into four categories: Stars, Cash Cows, Question Marks, and Dogs, each representing different levels of profitability and strategic importance.
Basically, it’s a way to analyze which products or product line add the move value to a business.

Stars
An organizations “Stars” are products that exist in a high growth market which the organization also has a high market share of. These are the rising heroes in an organizations product portfolio and, with good management and sufficient investment can mature into Cash Cows. Obviously, we want to keep these and invest in them.
Cash Cows
These are an organization’s products which are in low-growth (or mature) markets which the organization has a high market share of. These are the products that will just keep plodding along with little investment while generating revenue (and hopefully good contribution to the bottom line). These are the work-horses of our organizations (to mix metaphors). The profits they generate can support the organization’s investment and growth in other areas.
Question Marks
These are our unknown products. They’re an organization’s products in a high growth market, but a market at the organization has a low market share in. They’re not scaled enough to contribute significantly to the organization’s bottom line. It’s possible that with good stewardship and sufficient investment that they could turn into Stars, but it’s uncertain. An organization should make a bit of a go/no-go decision on them and either invest significantly, or sell them off / discontinue them.
Dogs
These are the products that are sort of no-hopers. They’re in a low-growth or contractionary market what the organization has a low market share in. They’re typically a net drag on an organization’s P&L and should probably be exited.
Learning More
We don’t have much to add on this. You might also benefit from exploring some similar tools like SWOT and PESTLE as well as some other decision making support tools like the Ease / Benefit Matrix and the Eisenhower Matrix.
Our View
It’s a classic and well respected tool to help leaders and organizations manage their product portfolios. We don’t have anything extra to say about it!
How We Help Organizations
We provide leadership development programmes and consulting services to clients around the world to help them become high performing organizations that are great places to work. We receive great feedback, build meaningful and lasting relationships and provide reduced cost services where price is a barrier.
Learning more about who we are and what we do it easy: To hear from us, please join our mailing list. To ask about how we can help you or your organization, please contact us. To explore topics we care about, listen to our podcast. To attend a free seminar, please check out our eventbrite page.
We’re also considering creating a community for people interested in improving the world of work. If you’d like to be part of it, please contact us.
Sources and Feedback
We picked this up at university, or even before, but think the orginal reference is:
Boston Consulting Group. (1970). The growth-share matrix. Retrieved from https://www.bcg.com/publications/1970/strategy-the-growth-share-matrix
We’re a small organization who know we make mistakes and want to improve them. Please contact us with any feedback you have on this post. We’ll usually reply within 72 hours.


